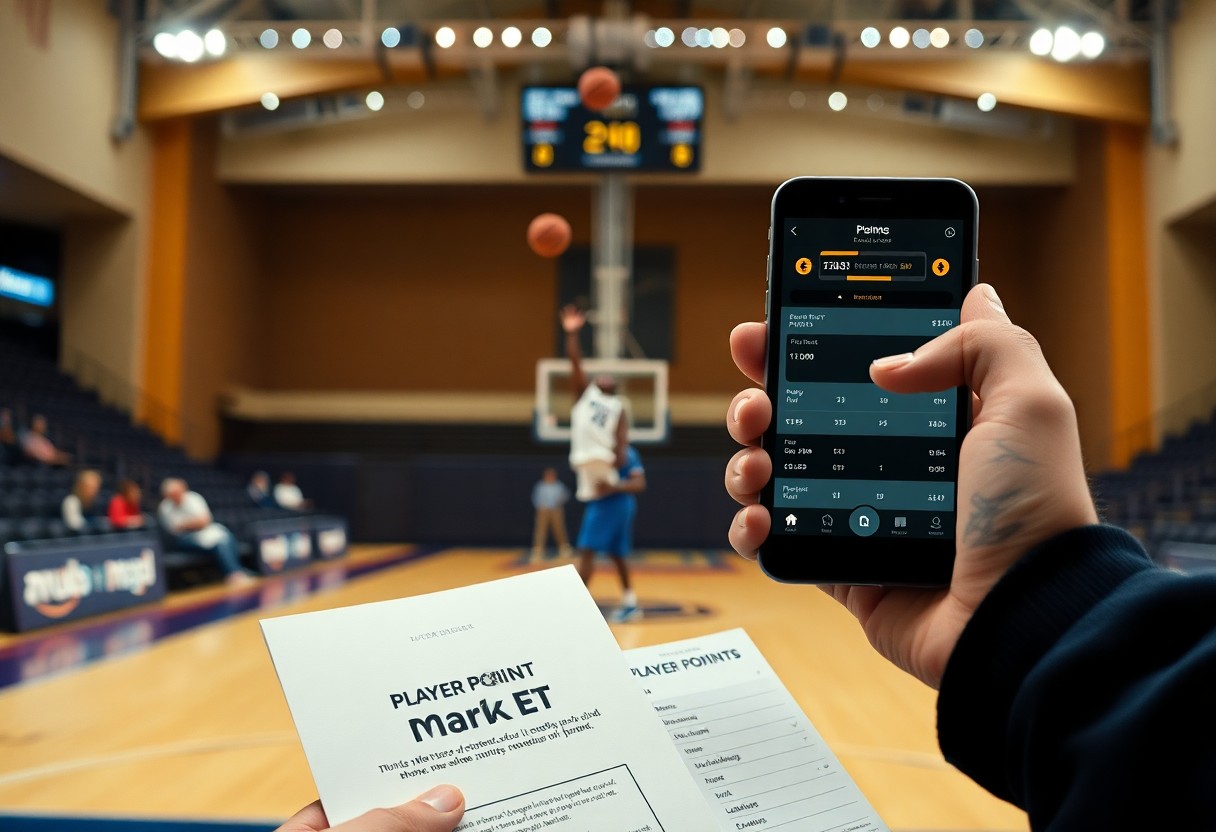
Guide to betting on player points in basketball gives beginners a clear, authoritative framework covering odds, player roles, minutes and matchup context; prioritize bankroll management as the most important practice, use line shopping and research for positive edge, and watch injuries, rest and sudden lineup changes as the biggest risks to avoid heavy losses. This guide teaches prop interpretation, staking plans and statistical checks to help you bet more consistently.
Understanding Player Points
Games’ pace, target share and coaching rotations directly shape a player’s scoring line: a guard with a 25% usage rate and 35 minutes typically posts 18-25 points, while a reserve at 18 minutes may average 6-10. Pay attention to injury news and matchup pace-teams facing opponents who concede many transition points inflate totals. Historical splits (home/away, vs zone) and recent minute trends reveal whether a player’s market line is mispriced.
Types of Player Points Bets
Common options include straight over/under props, period-specific bets (first half, quarter), player prop parlays, and comparisons like player A vs player B. Market odds can vary by sportsbook-some offer alternate lines or correlated same-game parlays that change expected value. Any late rotation or rest announcement can flip value instantly.
- Over/Under – single-line total for a game.
- First Half/Quarter – shorter sample, higher variance.
- Anytime/Bench – usage differs if starter sits.
- Player vs Player – compare projected points head-to-head.
- Same-Game Parlay – lines correlate; watch lineup news.
| Over/Under | Example: Leans on PPG and matchup; sportsbook sets 22.5 |
| First Half/Quarter | Example: Guard 1st half line 10.5; fewer minutes inflate variance |
| Player vs Player | Example: Player A 18.5 vs Player B 16.5; compare usage and matchup |
| Alternate Lines | Example: +3/-3 scoring swings payout; useful for confidence sizing |
| Same-Game Parlay | Example: Player points + team total; correlated risk if pace changes |
Common Scoring Metrics
PPG, usage rate, true shooting percentage (TS%), and points per 36 are the backbone of player scoring analysis. Usage shows shot opportunity share, TS% measures efficiency including free throws, and points per 36 normalizes minutes-combine these to gauge whether a 20-point average is sustainable or volume-driven.
For example, a player averaging 0.9 points per minute will likely score ~21.6 points over 24 minutes; if that player’s TS% is 55% and opponent allows 12% more points to his position, the market line may be depressed. Also watch small sample size spikes after injury returns and track how coaching changes alter role-both can misprice lines for sharp bettors.
Step-by-Step Guide to Betting on Player Points
Quick Action Plan
| Action | How to execute (examples) |
|---|---|
| 1) Data check | Analyze the last 10 games, minutes, usage rate (>20%), and matchup pace; if a player averages 0.9 points/min and projects 32 minutes, expect ~29 points. |
| 2) Injury & lineup | Confirm injury status, DNPs, or resting reports; a teammate out can add 3-6 points to a primary scorer. |
| 3) Line shopping | Compare at least 3 books for the best O/U and odds; a 0.5-1.5 point swing changes edge significantly. |
| 4) Stake & manage risk | Size bets by edge and variance; use smaller stakes on volatile matchups and track ROI per player over 50+ bets. |
Researching Players and Matchups
Prioritize concrete metrics: check a player’s minutes per game, usage, true shooting, and opponent defensive rating over the last 10 games; for example, a guard facing a team allowing 1.25 points per possession and playing ≥34 minutes often exceeds season averages by 3-5 points-adjust projections using pace and home/away splits and factor in recent role changes or coach rotation notes.
Finding the Right Betting Platform
Focus on books with deep player-prop markets, competitive odds, and transparent limits-compare DraftKings, FanDuel, BetMGM and a smaller sharp book; shop across 3-5 sites, target platforms offering live props and line history so you can react to late news and capture 0.5-2.0 point value swings.
Go beyond surface features: verify licensing (state, MGA, or similar), check max prop limits-many retail books cap new props at $100-$500 while sharp-friendly books allow $1,000+-and assess latency for in-game betting. Use platforms with clear cash-out rules, fast deposits/withdrawals, bet tracking, and robust mobile apps; watch promotional value but prioritize consistent low vig and reliable settlement, since a sudden voided bet or slow payout can erode long-term profitability.
Key Factors Influencing Player Performance
Focus on the interplay of minutes, usage rate, opponent defensive rating and game pace: players logging 30+ minutes with usage above 25% produce far more scoring volume, and teams at 102+ possessions tend to inflate totals. Account for rotation shifts, back-to-backs and foul trouble-these can swing a prop by 5-10 points. Thou prioritize minutes, matchup and role when sizing bets.
- Usage rate
- Minutes played
- Opponent defensive rating
- Pace of play
- Role / shot attempts
- Injury status
Team Dynamics and Match Conditions
When a primary scorer is out, secondary options often see a 5-10% jump in usage and a corresponding increase in shot attempts; for example, bench guards typically gain 3-6 extra field-goal attempts per game in such scenarios. Complexities like matchup mismatches, expected pace (teams averaging 100 vs 105 possessions) and projected rotation minutes should drive adjustments to lines, and monitoring projected starters gives an edge.
Player Form and Injury Reports
Gauge short-term trends by checking the last 5 games averages versus season numbers-if a player jumps from 12 to 20 points across five games, that signals an uptick. Combine that with official injury tags (out, doubtful, questionable) and practice participation; missed practices or a “did not participate” flag often precede limited minutes, which lowers scoring expectations.
Dig deeper into injury type: soft-tissue issues (hamstring, groin) typically impact explosiveness and shot volume more than a minor wrist or illness, and coaching minutes restrictions commonly reduce playing time by roughly 15-25% for the first few games back. Use historical return patterns for each player, morning-of-game updates and coach quotes to predict true workload rather than relying solely on injury label.
Tips for Successful Betting
Sharpened strategies focus on pregame player points props, projecting minutes and matchup impact rather than chasing lines. Use concrete thresholds: target players averaging >18 PPG with a usage rate above 20% and minutes projection >28. Track line movement and injury updates-late scratches can swing a prop by 4-8 points. Perceiving soft spots in the market lets you act before odds adjust.
- Bankroll: flat-bet 1-2% per stake
- Line shopping across books for better value
- Minutes projection over raw averages
- Last-10 game form and rest days
- Advanced stats like usage and on/off splits
- Avoid chasing losses after bad beats
Bankroll Management
Adopt a staking plan: flat bets of 1-2% of your bankroll preserve capital through variance-on $1,000 that’s $10-$20 per prop. Use unit sizing: increase only after sustained profit streaks, not single wins. Set a weekly loss cap and avoid chasing losses by doubling stakes; volatility in player props is high, so consistency beats aggression.
Analyzing Trends and Statistics
Focus on micro-trends: compare a player’s last-10 game scoring average to season numbers, minutes, and matchup defensive rating. For example, a guard at 15.2 season PPG but 21.8 over the last 10 with minutes up 6 per game suggests a real uptick. Include opponent pace and opponent points allowed to similar roles when sizing confidence.
Dig deeper into splits: use on/off minutes, home/away, and rest-based performance; a player who gains 4-6 minutes in the starter’s absence often adds 3-7 projected points. Combine sample size thresholds (minimum 5-7 games for a recent trend) with context-coach rotation changes or matchup weaknesses-to move from raw numbers to actionable edges.
Pros and Cons of Betting on Player Points
| Pros | Cons |
|---|---|
| Targeted market allows edges by analyzing minutes, usage, and matchups. | High variance-single-game swings often exceed 10+ points from expectation. |
| Many in-play opportunities to hedge or exploit substitution patterns. | Lines react quickly to late injury news, reducing pregame advantages. |
| Easier bankroll scaling: small unit bets (e.g., 1-2%) can be effective. | Limited lines and liquidity for role players; large stakes move markets. |
| Accessible data: minutes, usage, and matchup stats are widely available. | Small sample sizes for props (one game can skew averages and models). |
| Can exploit public biases (over/underreacting to hot streaks). | Bookmakers often set sharp vig on props, lowering long-term ROI. |
| Useful for diversified strategies beyond straight game bets. | Correlated outcomes (team scoring droughts) can ruin multiple prop bets. |
| Quick feedback loop helps refine models and identify profitable niches. | Requires constant monitoring of rotations and coach decisions. |
Benefits of Player Points Betting
Targeting high-minute, high-usage players-those logging 30+ minutes with usage above ~20%-often yields predictable volume: they routinely hit 18-25 points, making lines more exploitable. Using matchup data (opponent defensive rating, pace) and line shopping can deliver edges; for example, finding a 0.5-1.5 point discrepancy across books after late injury notes can shift expected value in your favor.
Risks and Considerations
Prop bets carry elevated volatility: single-game variance and late scratches can turn a projected 22.5-point line into a bust. Market sensitivity to rotation changes, injury news, and small sample noise means bankroll discipline and hedging are necessary to manage downside.
Practical risk control includes staking props at conservative sizes (commonly 1-2% of bankroll), actively line shopping, and using live hedges when minutes deviate; historical examples show a starter being ruled out hours before tip can move a line 2-4 points, converting a profitable pregame wager into a loss without quick adjustments.
Resources for Further Learning
Dive into specialized tools to refine projections: Basketball-Reference for game logs and per-36 numbers, PBPStats for play-by-play splits and on/off data, CleaningTheGlass for lineup minutes and play-type rates, and NBA.com/stats for tracking metrics. Many pros combine these with subscription models and betting-focused newsletters; paid data feeds often provide the edge, while free sites supply fast cross-checks before placing player points bets.
Recommended Reading and Websites
Consult Basketball-Reference for historical splits, PBPStats for possession-level tendencies, CleaningTheGlass for lineup and pace adjustments, and FiveThirtyEight for team ratings. Action Network and RotoGrinders publish model write-ups and variance analyses; for example, using PBPStats showed a backup’s scoring jump from 6.8 to 12.3 PPG over five starts, which moved prop lines significantly. Prioritize raw play-by-play and lineup minutes when modeling player points.
Communities and Forums
Use Reddit (r/sportsbook, r/nba), Discord groups, and X for real-time injury and lineup chatter; beat reporters often post minutes updates before books adjust, sometimes giving a 5-15 minute window to act. Treat these channels as rapid intel hubs but verify tips before wagering, since fan posts can amplify noise and create false edges.
Vet posters by track record, require at least two independent confirmations or an official team source, and watch for consensus plus immediate line movement. Track a few trusted beat reporters and Discord admins, log how often their info led to profitable lines, and adjust your reliance accordingly; require confirmation from two independent sources to convert social leads into wagers.
Final Words
Conclusively, “How To Bet On Player Points In Basketball – A Beginner’s Guide” equips newcomers with the fundamentals of analyzing player usage, matchup context, line shopping, and bankroll control to make informed bets; prioritize tracking injuries, rotations, pace, and in-game role changes while applying disciplined staking to improve accuracy and long-term results.
FAQ
Q: What does it mean to bet on player points and how do over/under props work?
A: Betting on player points means wagering on the number of points a specific player will score in a game. The sportsbook posts a line (for example, 22.5 points) and you choose over if you think the player will score 23 or more, or under if you expect 22 or fewer. Payouts reflect the odds and the bookmaker’s margin; some lines have -110 on both sides while others use different pricing. Props settle at the final official game statistics; fractional lines are resolved by the sportsbook’s rules (usually requiring whole number outcomes to determine pushes).
Q: What factors should a beginner analyze before placing a player points bet?
A: Evaluate projected minutes and role (starter vs. bench, expected usage), recent performance trends, matchup specifics (opponent’s defensive rating, who defends that player, pace of play), and team context (injuries, rest, back-to-back schedule, lineup changes). Check shooting volume and efficiency indicators-usage rate, field goal attempts, free throw attempts, and true shooting percentage-to gauge scoring opportunity. Monitor late-breaking news and starting lineup confirmations, and shop multiple sportsbooks for the best line and price to maximize value.
Q: How should I manage bankroll and avoid common mistakes when betting player points?
A: Use a fixed staking plan (e.g., 1-2% of bankroll per bet) or defined unit sizing to limit variance and preserve capital. Avoid oversized parlays of player props, chasing losses, or increasing stakes after short-term wins; treat each bet as an independent EV decision. Track results to identify strengths and weaknesses, prioritize line shopping and small edges, and accept that variance will produce short losing runs-focus on disciplined, long-term profitability rather than single-game outcomes.